Symfony-profiler
When the application is deployed in development mode, Symfony enables a debug component called the web profiler.
This component offers multiple features for developers to inspect the application at runtime. For attackers, a bunch of information can be extracted from the profiler: routes, cookies, credentials, files, etc.
Impacted Assets
The underlying server hosting the Symfony framework as well as the applicative components interacting if credentials are found.
Exploit or command to run
You can access the Symfony profiler dashboard with the following URL :
{IMPACTED-ASSET}/app_dev.php/_profiler/empty/search/results?limit=10
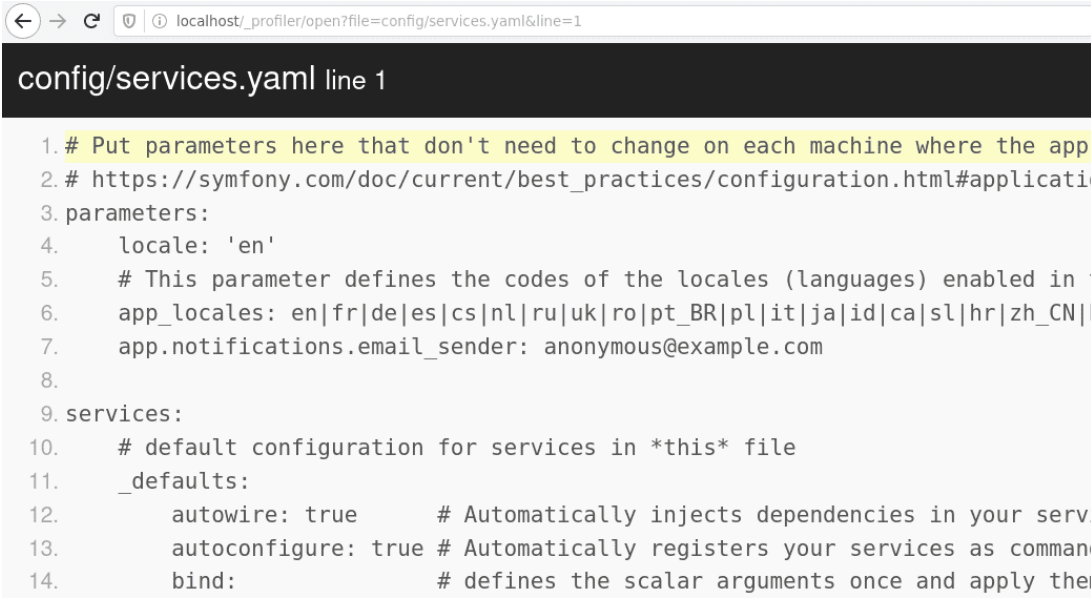
From Symfony 3.x, the web profiler allows reading application files under the root directory. This feature is used by developper to quickly identify the source code responsible for handling a request. However, it can be abused to read configuration files:

We can then read applicative configuration files potentially containing technical secrets (database credentials, applicative sessions tokens).
Consequences
Cyber-terms
In the scenario the attacker obtain valid credentials, the impact is tied to the secret identified (access to the database, access to the application ...). The impact can range from confidentiality of technical details to the compromise of the database information.
Managerial terms
The impact of the vulnerability can range from little impact to direct financial losses by altering the content of the compromised database or the underlying server.
Remediation
You can disable the debug mode by editing the Symfony configuration file:
# app/config/config.yml
framework:
    profiler:
        enabled: false